
Advisory: Be careful of what you read on social media. The algorithms used by these platforms have no regard for Biblical truth. They target your emotions to keep you engaged on their site so their advertisers can drop more ads. These platforms exist to enrich their stockholders. Consider God’s promise to Believers in James 1:5, “If any of you lacks wisdom, you should ask God, who gives generously to all without finding fault, and it will be given to you.”
Featured Story
Dollar-denominated financial markets appeared to suffer a dramatic change on or about the 23 March. This article examines the possibility that it marks the beginning of the end for the Fed’s dollar.
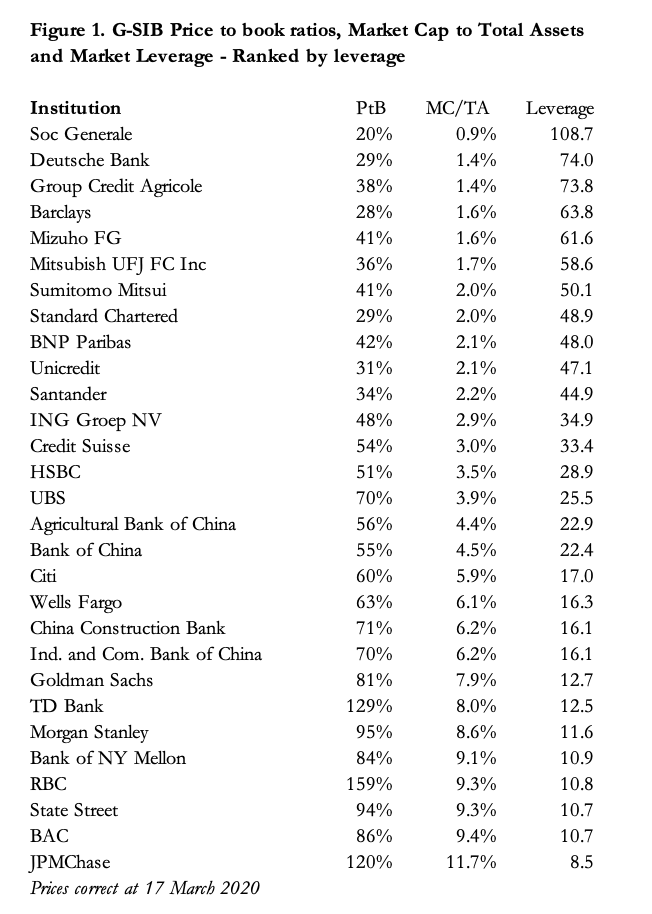
At this stage of an evolving economic and financial crisis, such thoughts are necessarily speculative. But an imminent banking crisis is now a near certainty, with most global systemically important banks in a weaker position than at the time of the Lehman crisis. US markets appear oblivious to this risk, though the ratings of G-SIBs in other jurisdictions do reflect specific banking risks rather than a systemic one at this stage.
A banking collapse will be a game-changer for financial markets, and we should then worry that the Fed has bound the dollar’s future to its fortunes.
The dollar could fail completely by the end of this year. Against that possibility, a reset might be implemented, perhaps by reintroducing the greenback, which is not the same as the Fed’s dollar. Any reset is likely to fail unless the US Government desists from inflationary financing, which requires a radically changed mindset, even harder to imagine in a presidential election year.

Introduction
The most important mistake economists and financial watchers make is to assume events and prices tomorrow are simply projections of those of today. It is the basis of all economic and financial modeling. Yet despite the hard lessons of experience economic forecasters persist with their misleading models.
Nowhere is the failure of linear projection from the past more important than in the lifeblood common to everything. While knowing that state-issued currencies change in their utility over time, almost no one expects their demise, other perhaps at some point in the far distant future. But what if this generally linear expectation is as wrong as all other forecasting models? What if the response to the current economic crisis is more rapid depreciation of currencies? And what happens if they die altogether? And what are the consequences for the ordinary person?
This article explores these what-ifs. It examines the conditions that could lead to this outcome. History gives us a guide, not through extrapolation, but by telling us that every recorded currency collapse has occurred to fiat currencies unbacked by gold or silver. So, we know it will happen — eventually. Less understood is that the pattern is always the same: a prolonged period of falling purchasing power, followed by a sudden collapse when a currency’s users finally reject it. In terms of time, the latter phase usually lasts approximately six months.
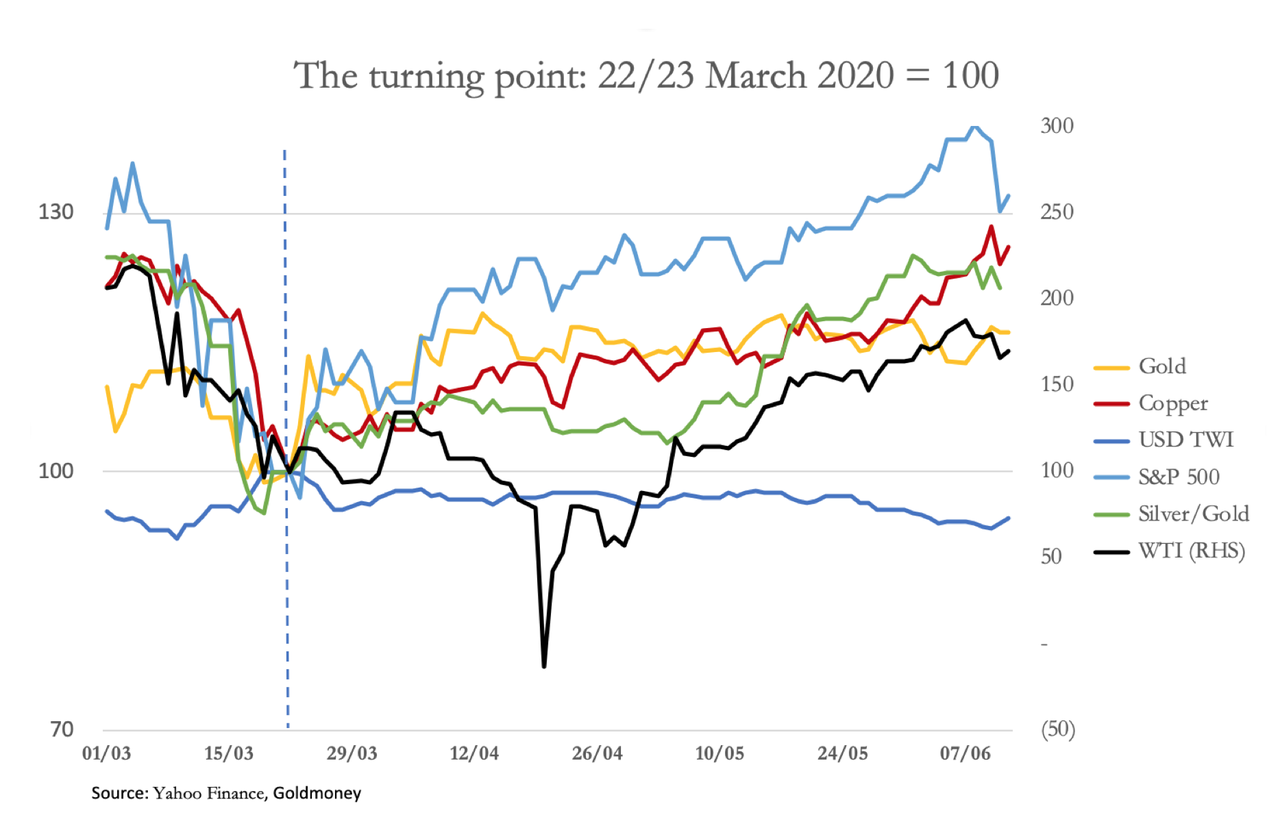
Assessing the turning point
The early morning of Monday, 23 March was a significant time, marking the top of the dollar’s trade-weighted index. At the same time, gold, silver, and copper prices have fallen in the weeks before they turned sharply higher. And while oil initially followed, it was a month before it resumed its uptrend — delayed by the delivery hiatus in the futures markets which briefly drove the price negative. The S&P 500 rallied the following day, ending a near 30% decline before recovering all of it, and then some.
Something had changed. Either market decided that economic growth, both in the US and the rest of the world was going to continue following lockdowns, and growing demand for key commodities was going to be resumed. Or, as the decline in the dollar’s TWI indicated, the purchasing power of the dollar was going to decline, and commodity prices were reflecting an accelerating downtrend for the dollar’s purchasing power.
The performance of the S&P 500 since 23 March, being unhinged from any business conditions, gives us a clue: the flood of money emanating from the Fed is fuelling stock prices. It is also fuelling prices of all other financial assets.
The turnaround in silver is a more subtle story, shown in the chart as the reciprocal of the more usual gold/silver ratio. Silver had been ignored, classed solely as an industrial metal. Gold was seen by the financial community as the only metallic hedge against uncertainty in the financial system. That changed on 23 March when the gold/silver ratio peaked at 125 on the previous business day. It is now beginning to outperform gold with the gold/silver ratio currently down to 98. We might look back and pinpoint this time as marking the beginning of a return to some moneyness in silver.
The weeks before had seen the Fed ease monetary policy. On 3 March, the Fed cut its funds rate from 1 ½% to 1%. In the accompanying announcement, the Fed said that the fundamentals of the economy remained strong, but the coronavirus posed evolving risks to the economy.
On 15 March, the Fed cut its funds rate again, this time to zero, but the statement now said the coronavirus had harmed communities and disrupted economic activity in many countries, including the US. On a twelve-month basis, overall price inflation and price increases for other than food and energy were running at below 2%. The Fed announced a renewed quantitative easing of at least $500bn of Treasury purchases and $200bn of mortgage-backed securities “in the coming months”. It was “prepared to use its full range of tools to support the flow of credit to households and businesses and thereby promote its maximum employment and price stability goals.”
That day the Fed made two other announcements. The first detailed arrangements for the encouragement of credit expansion to support both consumers and businesses, including the reduction of reserve ratios for all banks to zero. The second concerned the reduction of costs in drawing down USD swap lines at the other major central banks. They were followed over the course of the week by a series of announcements facilitating the availability of credit.
Clearly, the Fed was engaging the ultimate in aggressive monetary policies. And taking a phrase from the last head of the ECB, the Fed had signaled it was prepared to do whatever it takes without limitation. But the response in the markets took a week to develop into an inflection point, a normal pause before a new direction is found.
Central bank inflation and bank credit difficulties
Since the Fed is one step removed from the non-financial economy it relies on commercial banks to implement its monetary policy. But commercial banks will only act as the Fed’s agents if they are confident the rewards are greater than the risks involved. If the current crisis is simply a matter of the coronavirus being contained before everything returns to normal, then bankers might be prepared to take a punt on an increase of bank lending.
But as time passes, the losses mount. Business and consumer defaults are increasing, and the prospects for a rapid recovery appear to be receding. Furthermore, liquidity strains in the banking system are resurfacing, despite the massive injections of QE by the Fed. After subsiding from the panicky days of last September, overnight repos are on the increase again totaling anything between $20—$100bn daily.
It has been generally forgotten that the global economy was already facing a recession before the virus lockdowns. Trade wars between America and China and bank credit expansion having run for a decade were a repeat of the conditions that led to the Wall Street Crash in 1929 when the Smoot-Hawley Tariff Act following the roaring twenties was enacted, bank credit imploded, and the 1930s depression followed. Similarly, banks are now highly leveraged on their balance sheets and fear of bad debts has taken over from lending greed. The global banking cohort is increasingly desperate to reduce balance sheet commitments at the same time as the Fed and other central banks are frantic to see them expanded.
It is no wonder that the Fed’s expansion has remained bottled up in financial markets, driving financial assets even further into dangerous overvaluation territory. Consequently, without liquidity flowing more freely into the non-financial economy, bad debts can only deteriorate further, with loan risk rapidly increasing for commercial banks.

Systemic issues are being ignored
When the coronavirus first became an economic issue, there were mounting concerns over payment failures in supply chains. In the US, these payments are effectively the equivalent of gross output, which at the end of last year was running at $38 trillion. While we regard gross output as the value of products as they flow through their production stages, the payments flow the other way, back down the chains. Therefore, the $38 trillion figure can be taken as a proxy for the sum of all supply chain payments in the US, which must be added to the dollar equivalents of supply chain payments outside the US for semi-manufactured imports.
Not all supply chains have been completely disrupted, so the good news is payment disruptions onshore should be significantly less than $38 trillion but could easily be half that. But there is likely to be additional disruption from abroad, a point addressed by the Fed when it increased the number of central banks (but not China) having access to its swap lines.
The risks to commercial banks are not so much from the largest corporations, likely to be bailed out if in trouble, but from lower tiers of borrowers. This affects banks with exposure to collateralized loan obligations, which are bundled loans to companies often unable to raise funds any other way — today’s version of the collateralized debt obligations that blew up the banking system in 2008. Additionally, banks have direct loans and revolving capital exposure on their balance sheets with all businesses in the $38 trillion of onshore supply chains.
The market capitalization of the US’s G-SIBs — global systemically important banks — is less than a trillion dollars. Yet the supply chain failures that they are expected to backstop are many trillions — multiple times their market capitalization, and even of their balance sheet equity.
It seems hardly possible that the US banking system will survive the current supply chain disruption without help. The added bad news is that the US G-SIBs are rated much more highly in stock markets than their Chinese, Japanese, Eurozone, Swiss, and UK competitors, shown in Figure 1 above. It indicates that a systemic failure in dollar-denominated financial markets is not widely expected, given the generally higher market ratings afforded to US G-SIBs than for those in other jurisdictions. This probably explains why this topic is not yet a significant issue for dollar investors, though individual bank failures are more obviously an issue in other jurisdictions, where some G-SIB price to book ratios are below 30% while those of US G-SIBs average 93%.
The next significant event therefore will almost certainly be the failure of a G-SIB, if not in America, then elsewhere. Given the sheer scale of the problems in supply chains in all currencies and the accumulating bad debts attributable to lockdown, it could happen in a matter of weeks. Presumably, failing banks will be taken into public ownership with the Fed backstopping it with yet more inflationary finance. The impact on the Fed’s balance sheet, which has already grown to over $7 trillion will probably be several times its current size. But that, on its own, may not be enough to destroy the dollar.
A more direct danger is posed from monetary policies aimed at supporting financial asset values. In common with other major central banks, the Fed has become reliant on a policy of ultra-low interest rates to fund its government’s deficit. At the same time, there has been a longstanding belief, particularly in America, that rising prices for financial assets, chiefly stocks, have been vital to generate a wealth effect and therefore maintain public confidence in the economic outlook. In current markets, this overvaluation policy has been taken to extremes with even teenagers reportedly buying fractionalized stocks through aggregating platforms, such as Robinhood, as if it is a just another computer game.
The dollar’s inevitable descent


In more normal times the excessive speculation in the markets seen today would encourage the Fed to inject some caution into monetary policy, but the Fed cannot backtrack for fear of triggering a catastrophic collapse. Consequently, the future of the dollar has become firmly tied to that of confidence in financial markets.
With a rapidly escalating budget deficit, the US Government has a growing funding requirement, the cost of which already absorbs $400bn in interest charges annually. The Trump administration had increased its deficit to record levels in the good times when tax revenue was buoyant. And now the crisis has hit, higher interest rates will expose the US Government to a debt trap. This is a weapon the Fed cannot use.
As noted above, the next market shock is likely to be a systemic failure in the banking system. It matters not where that occurs, but when it does it makes bank depositors autarkic. Not only do they withdraw funds from banks they deem to be at risk thereby increasing their problems, but they also reduce cross-border currency exposure. The dollar is most exposed of all currencies to the latter risk: on last known figures foreigners owned about $25 trillion in securities, short-term paper, and bank deposits, while Americans held roughly half that invested mainly in illiquid production facilities abroad, limited portfolio exposure to listed securities and with very little liquid foreign currency exposure.
In our headline chart, we noted that the dollar’s turning point was 23 March and its subsequent downturn was part of a bigger commodity picture with gold, silver, copper, and — belatedly — oil prices rising. In March, US TIC data showed that foreigners reduced their dollar exposure by $227.9bn, only offset by US residents’ net sales of foreign securities of $133.3bn.[ii] Here is the evidence that in troubled times money heads for home. Additionally, that month saw a trade deficit of $44.4bn suggesting total foreign-related dollar selling amounted to $177.7bn. This is only part of a bigger dollar picture, but it does appear foreigners were reducing their dollar exposure at the time that the dollar’s TWI peaked on 23 March.
This is important because there are two market factors that have always led to a fiat currency collapse. The first is selling by foreigners, which appears to have commenced, and in this respect, the dollar is particularly exposed. With some $25 trillion invested in US securities etc., the potential destruction to the dollar’s purchasing power from this source is significant. As global trade shrinks further, not only will foreigners be driven by the need to redeploy dollars into their currencies of origin, but they will stop funding the US Government, choosing to sell down their US Treasury holdings, a process which has already started. If the Fed is to successfully fund the growing budget deficit it must absorb foreign sales of US Treasuries as well as maintain sufficient levels of QE to fund a rapidly increasing budget deficit.
Just imagine the consequences of a systemic failure. The spell cast over financial assets will be broken. First, investors and speculators are likely to turn their attention to equities, being obviously the most overvalued financial assets at a time of intensifying crisis. Foreign investors will join, selling down their portfolio exposure, repatriating some, if not all of the proceeds by selling dollars as well. Next, with a falling dollar and a growing sensitivity to the political aspect of the crisis, market participants will reassess the US Government’s funding requirements and question the yield suppression policy of the Fed. Dollar selling seems bound to intensify.
It will then become obvious to everyone that the Fed is sacrificing the dollar in order to fund the government, keep the banking system going and to support the economy by attempting to provide the liquidity to defray supply chain failures. It will already be demonstrably failing to support financial asset prices, which has become the visible manifestation of a successful monetary policy. It would be a miracle if this failure, in Trump’s election year with a socialistic president being lined up by the Democrats, does not lead to a full-blown financial and dollar crisis.
Unless the Fed can raise interest rates to the point where it is too expensive for speculators to short the dollar (which we can rule out), it will enter the second phase of its collapse, driven by US residents realizing the dollar is losing purchasing power, rather than prices rising. The purchasing power of any money depends on the balance between money and goods maintained by its users. If they collectively reject the money in favor of goods, then money’s purchasing power declines, potentially to zero. Following foreign selling, this is the second phase of the destruction of a fiat currency, which in past examples, has taken roughly six months for it to become worthless.
There are three factors that could shorten this timescale even further: the replacement of cash and cheques by digital payments, modern communications leading to the rapid spread of information, and as a consequence of the development of cryptocurrencies, wider public foreknowledge of the weaknesses of unbacked fiat currencies.
The case for fiat currency survival beyond 2020
The circumstantial evidence that the dollar will collapse before the year-end is mounting. Cassandra opened her casket, the evils escaped, and only hope remains trapped.
Or so it seems. We cannot divine the future. We can only sift the evidence, be aware of common fallacies, and avoid the temptation to wrongly extrapolate from yesterday into the future. While our method may be better than the macroeconomic forecasting beloved of the establishment, a predicted outcome is never a reality. And it is possible the US Treasury might attempt a reset, perhaps using Treasury dollars, otherwise known as greenbacks, which were last issued in 1971. But without axing government welfare commitments to the American public, returning to balanced budgets and abandoning Fed dollar-denominated debt this sort of legerdemain is unconvincing. Furthermore, the dollar’s reserve role for other currencies would have to be abandoned because of the monetary inflation involved in Triffin’s dilemma. And other currencies tied to the Fed’s dollar held in their reserves would still face their own collapse.
A reset abandoning the Fed’s dollar in favor of greenbacks is possible. But history has shown that the introduction of a replacement currency for one that has collapsed fails unless government financing by monetary expansion is demonstrably abandoned. Only time will tell whether in a presidential election year the US Government musters the clarity of purpose to implement a new lasting dollar regime.
The US Treasury says it still has over 8,000 tonnes of gold. If it is willing to drop its neo-Keynesian economics and its long-standing denial of gold’s monetary function, America could reintroduce gold convertibility for the greenbacks. This would probably be the last resort. It reneges on the Fed’s balance sheet note — which in these conditions would be its only significant asset, involves the abandonment of the welfare state and America’s longstanding geopolitical aims, and it allows China to gain a potential advantage by displacing the dollar with more convincing gold convertibility of its own.
China has deliberately cornered the gold bullion market in plans that go back to the time of Deng. Almost certainly, following the introduction of its Regulations on the Control of Gold and Silver (1983), the Chinese state accumulated sufficient gold for its strategic purposes by the time it then permitted its citizens to buy gold with the opening of the Shanghai Gold Exchange in 2002. The gold acquired by the state at that time is not declared as monetary gold and the quantity is unknown, but after examining inward investment flows net of trade deficits in the 1980s and growing export surpluses subsequently, a ten percent allocation of foreign exchange gained into gold at contemporary prices suggests a position of some 20,000 tonnes of bullion was likely to have been accumulated by 2002.
There is no way of establishing the facts, and therefore statements about the Chinese state’s ownership of bullion are necessarily speculative. But additional evidence is compelling:
- China is now the largest gold mining nation by far, extracting an estimated 4,200 tonnes since 2010, more than any other nation. This has been driven by government policy.
- The state controls all Chinese gold and silver refining, taking in doré from abroad to add to Chinese stocks. At the same time, virtually no Chinese refined gold kilo bars are permitted to leave the country.
- In 2002, when the Shanghai Gold Exchange was set up by the Peoples’ Bank of China the Chinese government encouraged its nationals to acquire physical gold, even advertising its attractions in state media. Since 2010 alone, 17,200 tonnes have been delivered into public hands by the SGE. These figures were achieved by importing bullion from the West in enormous quantities.
- Its allies in Asia, principally members of the Shanghai Cooperation Organisation, have also been acquiring gold. Russia has been particularly aggressive in dumping dollars for gold.
- China now dominates physical gold markets and can be said to control them.
Given all these verifiable facts, it seems unlikely that a state which centrally plans would not have acquired for its own use substantial quantities of bullion ahead of the establishment of the SGE. America knows it and continues to resist gold having a monetary role. If America’s anti-gold policy changed, it would restrict the dollar’s circulation abroad. It would mark the end of dollar hegemony and a gold-backed yuan would become the foreign currency of choice throughout Asia, eastern Europe, the Middle East, and Africa.
Conclusions and consequences
A banking crisis in the coming weeks is an increasingly likely event, given the scale of disruption to supply chains. The escalation of bankruptcies and of non-performing loans worldwide will almost certainly take the banking system down. It will be a watershed, a wake-up call to all those who expect a return to normality after the coronavirus passes.
For the moment, central banks are throwing money at the problem; money which remains stuck in financial assets, inflating them even further, and not being transmitted to the non-financial economy by banks already over-leveraged to failing borrowers.
We can be certain central bankers and government treasury departments are only now grasping the enormity of these problems, but they are still behaving as if chucking money at them is a viable solution. They will only destroy their unbacked fiat currencies, and that destruction, starting with the dollar, is already in progress. The clock is ticking from 23 March. While there may be attempts at a fiat money reset, without clear legal commitments from central banks and treasury departments to end inflationary financing, any reset will only delay currency destruction by a matter of months.
The consequences of such an outcome are always devastating, the more so because all major westernized central banks are committed to the same inflationary policies at the same time. The political consequences do not bear thinking about.
At some stage, hopefully, sooner rather than later, metallic money will regain circulation. And when prices are set in gold or silver, perhaps through fully backed substitutes, the stability they bring will end the trappings of fiat currencies. All this destruction is measured in current terms, nearly all from statistics collected by the Bank for International Settlements.
Gone will be worldwide fiat currency debt, amounting to some $250—$300 trillion. Gone will be all OTC derivatives which settle in fiat, amounting to a further $560 trillion. Gone will be listed derivatives, a further $33 trillion. Gone will be options, a further $65 trillion. All these, totaling over $900 trillion, are only part of the destruction.
Global deposits held as bank balances totaling $60 trillion will evaporate. Worldwide equity markets denominated in fiat are a further $70 trillion; anything that does not migrate from fiat pricing disappears, including most, if not all ETFs. Goodbye to hedge funds. Goodbye to offshore financial centers. Goodbye to onshore financial centers. Goodbye to $100 trillion of fiat money.
Life will be very different, and those not prepared for it, principally by retaining a store of non-fiat, sound money, which can only be physical gold and silver until credible substitutes arise, will face impoverishment. Measured in real money, the value of non-financial physical assets will collapse due to the preponderance of desperate sellers to whom survival is most important, even though priced in worthless fiat their prices will have risen. The experience of inflationary collapses in Germany and Austria in the early 1920s showed the way when country estates went for almost nothing in gold-back dollars and $100 would buy a mansion in Berlin.
None of this is expected. It may not happen, but the chances of it happening appear to have increased significantly from 23 March.
Another Problem…
US Oil Dominance Coming To An End…
- U.S.’ energy dominance agenda is dead as the country’s shale industry is looking at a steep production decline.
- The U.S. tight oil or shale rig count has fallen 69% this year from 539 in mid-March to 165 last week.
- U.S. oil import dependence is set to grow in the next couple of years.

U.S. energy dominance is over. The output is probably going to drop by 50% over the next year and nothing can be done about it. It has nothing to do with the lack of shale profitability or other silly memes cited by people who don’t understand energy.
It’s because of low rig count.
The U.S. tight oil or shale rig count has fallen 69% this year from 539 in mid-March to 165 last week. Tight oil production will decline by 50% by this time next year. As a result, U.S. oil production will fall from less than 8 mmb/d by mid-2021.
What if rig count increases between now and then? It won’t make any difference because of the lag between contracting a drilling rig and first production.
The party is over for shale and U.S. energy dominance.
Energy Dominance is Over
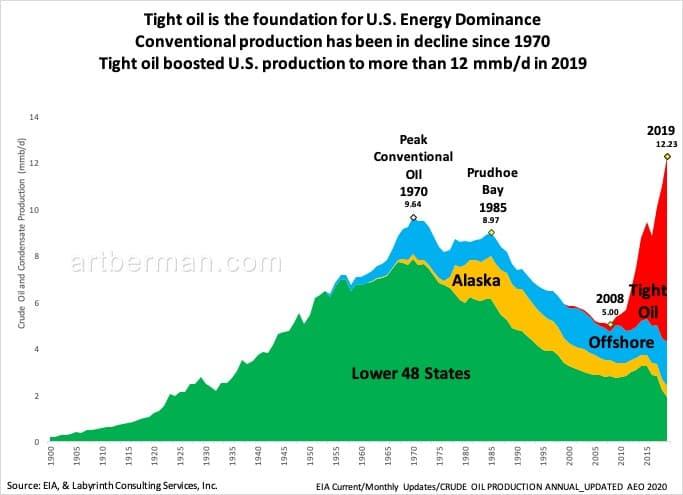
Tight oil is the foundation of U.S. energy dominance. The U.S. has always been a major oil producer but it moved into the top tier of oil superpowers as tight oil boosted output from about 5 to more than 12 mmb/d between 2008 and 2019 (Figure 1).
Conventional production has been declining since 1970. It fell from almost 10 mmb/d in 1970 to 5 mmb/d in 2008.
Figure 1. Tight oil is the foundation for U.S. Energy Dominance.

Conventional production has been in decline since 1970. Tight oil boosted U.S. production to more than 12 mmb/d in 2019.
Source: EIA and Labyrinth Consulting Services, Inc.
Tight Oil Rig Count and Oil Production
Rig count is a good way to predict future oil production as long as the proper leads and lags are incorporated.
It takes several months between an upward price signal and a signed contract for a drilling rig. It takes another 9-12 months from starting a well to the first production for tight oil wells. With pad drilling, usually, all wells on the pad must be drilled before bringing in a crew to frack the wells.
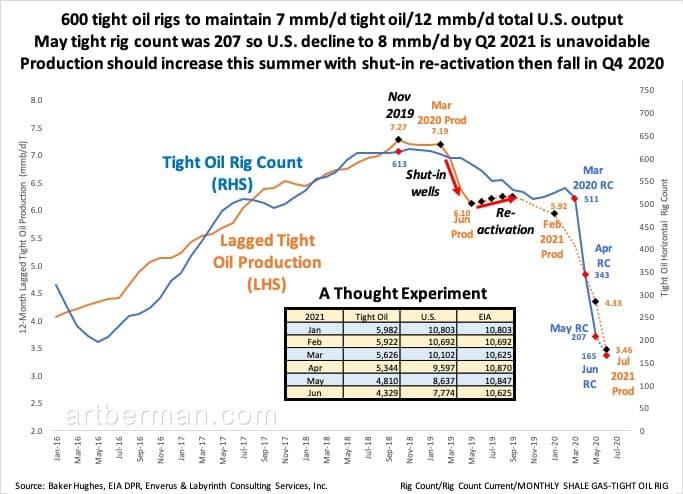
Tight oil horizontal production reached 7.28 mmb/d in November 2019 when the lagged rig count was 613 (Figure 2). That corresponded to 12.9 mmb/d of U.S. oil production—tight oil is about 55% of total output. Approximately 600 rigs are needed to maintain 7 mmb/d of tight oil and 12.5 mmb/d of U.S. production.
The horizontal rig count is now 165 so it is unavoidable that production will fall. The considerable lags and leads mean that production decline cannot be expected to reverse until well into 2021 assuming that it starts to increase immediately. That won’t happen because of constrained budgets and low oil prices.
Figure 2. 600 tight oil rigs to maintain 7 mmb/d tight oil/12 mmb/d total U.S. output.
May tight rig count was 207 so U.S. decline to 8 mmb/d by Q2 2021 is unavoidable. Production should increase this summer with shut-in re-activation then fall in Q4 2020.
Source: Baker Hughes, IEA DPR, Enverus and Labyrinth Consulting Services, Inc.
U.S. producers shut in most of their wells in May because oil prices had collapsed and storage had reached its limits. Tight oil production has fallen more than 1 mmb/d to 6.2 mmb/d and total U.S. output is around 10.5 mmb/d.
With the storage crisis now apparently averted and with somewhat higher oil prices, most tight oil wells are being re-activated. Production should increase until all shut-in wells are back online and then, it will resume its decline.
Based on rig count analysis, U.S. oil production will probably be about 8 mmb/d by mid-2021 or more than 4 mmb/d less than peak November 2019 levels.
Killer Decline Rates Require Lots of Rigs
Lower U.S. crude and condensate production is unavoidable with rig counts where they are today. That is because tight oil decline rates are really high.
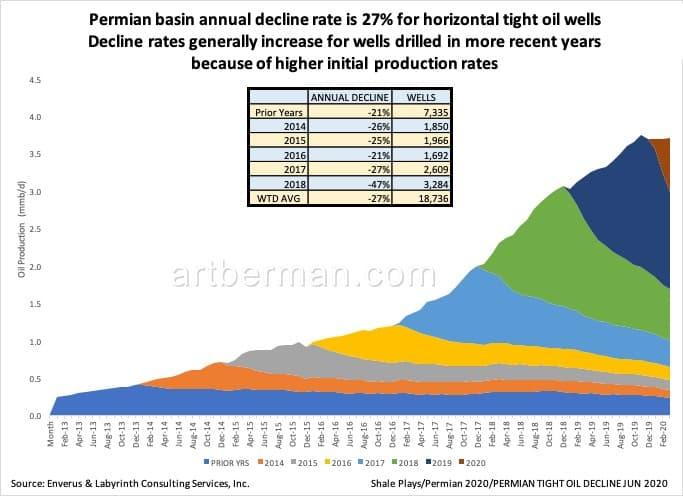
Figure 3 shows the Permian basin shale play decline rates by year of the first production. The average of all years is 27% per year. More recently drilled wells decline at higher rates because of better drilling and completion technology. The problem is that the wells don’t have greater reserves—they just produce the reserves faster. That means higher decline rates.
Figure 3. Permian basin annual decline rate is 27% for horizontal tight oil wells

Decline rates generally increase for wells drilled in more recent years because of higher initial production rates.
Source: Enverus and Labyrinth Consulting Services, Inc.
This is not a criticism of the plays or the companies. It’s just a fact.
And that’s why it’s critical to keep 500 or 600 rigs drilling all the time—to replace the 30% of output lost every year to depletion.
Production can be turned off and on as it was in May and June. Production cannot be increased without adding rigs and drilling new wells. Assuming there was infinite capital available to add rigs and drill wells, it would take several years to increase rig count to levels needed to maintain 2019 output levels.
Drilled, uncompleted wells (DUC) may be brought on to slow the rate of production decline somewhat. It is important to note, however, that completion accounts for at least 50% of the total well cost. Capital constraints and low oil prices will affect the ability and enthusiasm of companies to complete DUCs.
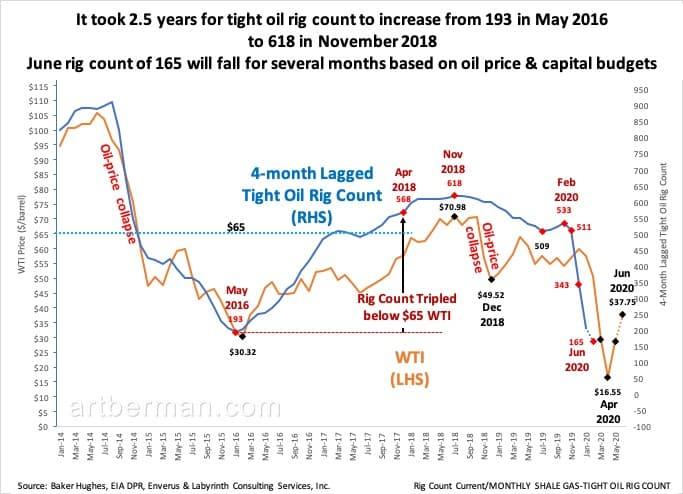
After the last oil-price collapse, it took 2.5 years for tight oil rig count to increase from 193 in May 2016 to 618 in November 2018 (Figure 3). There were thousands of DUCs during the last oil-price collapse in 2014-2017 but they didn’t have much effect on production decline.
The current June rig count of 165 will continue to fall for several months because of low oil price & capital budgets.
Figure 4. It took 2.5 years for tight oil rig count to increase from 193 in May 2016 to 618 in November 2018.
June rig count of 165 will fall for several months based on oil price & capital budgets.
Source: Baker Hughes, IEA DPR, Enverus and Labyrinth Consulting Services, Inc.
Rigs Don’t Produce Oil, Wells Do
I’ve shown how to rig count, lagged production, and decline rates are used to estimate future levels of production. That approach is useful but the truth is that rigs don’t produce oil—wells do.
Another approach, therefore, is to compare the number of tight oil wells that were drilled and completed during each of the last 5 years to the corresponding average production rates for each of those years. Then, using year-to-date drilling and completion data, we can annualize and project what 2020 production is likely to be.
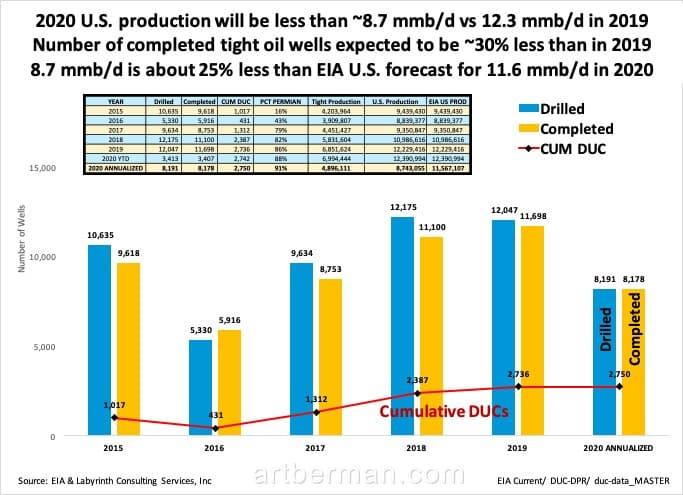
This approach suggests that 2020 tight oil production will be about 30% less than in 2019 (Figure 4). Since tight oil represented 56% of total U.S. output in 2019, we may then estimate that U.S. production will average about 8.7 MMB/d in 2020.
Figure 5. 2020 U.S. production will be less than ~8.7 mmb/d vs 12.3 mmb/d in 2019.
Number of completed tight oil wells expected to be ~30% less than in 2019. 8.7 mmb/d is about 25% less than EIA U.S. forecast for 11.6 mmb/d in 2020.
Source: EIA and Labyrinth Consulting Services, Inc.
That is similar to the estimate obtained from the rig count approach. It is, however, about 25% less than EIA’s 2020 forecast for U.S. crude & condensate production.
Energy Dominance and Green Paint
Much lower U.S. oil production is bad for Trump’s Energy Dominance anthem and its corollary that the U.S. is energy independent. It’s even worse for oil prices and the U.S. balance of payments once demand recovers. We will have to import even more oil than we do today and it will cost more.
The idea of U.S. energy independence is ignorant at best and fraudulent at worst. The U.S. imported nearly 7 MMB/d of crude oil and condensate in 2019 and more than 9 MMB/d of crude oil and refined products. That’s almost as much as China—the world’s second-largest economy—consumes.
The U.S. is a net exporter in the same way that shale companies are making huge profits—by accounting sleight-of-hand.
The U.S. imports other people’s crude oil, refine it and then, exports it. If a country imports unpainted cars, paints them green and then exports them, is it a net exporter of cars? No. It’s an exporter of green paint.
The U.S. is screwed when it comes to near- to medium-term oil production. It’s not because of Covid-19. U.S. rig count began to decline 15 months before anyone had heard of Covid-19. Even if the road to economic and oil-demand recovery is faster than I believe it will be, it will take a long time to get back to 12 or 13 million barrels per day of production.
There are good reasons to expect that much lower U.S. oil production will eventually lead to higher oil prices. That may result in renewed drilling and another cycle of oversupply and lower oil prices. That is how things have developed in the past.
But a new phase of economic reality and oil pricing is unfolding and no one knows where it will lead. Lower demand may mean that reduced U.S. oil output is appropriate. The only thing that seems certain is that the U.S. will not be the oil superpower it was before 2020.
The World Is In Big Trouble, for Those That Believe We Will Go Back to Some Sense of Normal Life Here on Earth, You Will Be Sadly Disappointed, Seven and Half Years of Hell on Earth Which Began January 1, 2020
“Our courts oppose the righteous, and justice is nowhere to be found. Truth stumbles in the streets, and honesty has been outlawed” (Isa. 59:14, NLT)…We Turned Our Backs On GOD, Now We Have Been Left To Our Own Devices, Enjoy…
While Mainstream Media Continues to Push a False Narrative, Big Tech Has to Keep the Truth From Coming out by Shadow Banning Conservatives, Christians, and Like-Minded People, Those Death Attributed to the Coronavirus Is a Result of Those Mentioned, They Truly Are Evil…
Source: HNewsWire ZeroHedge ZeroHedge
StevieRay Hansen
Editor, HNewsWire.com
Watchmen does not confuse truth with consensus The Watchmen does not confuse God’s word with the word of those in power…
In police-state fashion, Big Tech took the list of accused (including this site), declared all those named guilty and promptly shadow-banned, de-platformed or de-monetized us all without coming clean about how they engineered the crushing of dissent, Now more than ever big Tech has exposed there hand engaging in devious underhanded tactics to make the sinister look saintly, one of Satan’s greatest weapons happens to be deceit…
The accumulating death toll from Covid-19 can be seen minute-by-minute on cable news channels. But there’s another death toll few seem to care much about: the number of poverty-related deaths being set in motion by deliberately plunging millions of Americans into poverty and despair.
American health care, as we call it today, and for all its high-tech miracles, has evolved into one of the most atrocious rackets the world has ever seen. By racket, I mean an enterprise organized explicitly to make money dishonestly.
All the official reassurances won’t be worth a bucket of warm spit. The Globals are behind the CoronaVirus, It Is a Man-Made Bioweapon.
For those of you who care, Google and your favorite social media platforms have misled you, and now we all pay a heavy price for trusting the ungodly, Google and company, They knew exactly what they were doing, removing our history while preparing you to accept the New World Order playbook, Enjoy.


Tagged In
Newsletter
Must Read


Other Sources

Latest News

The Real Reason Vaccines Are Being Pushed So Hard, Kill Shot — Tribulation
FakeBook, Tweeter Gab, and YouTube Are Un-Reliable News Source/ J. D. Rucker, writing at NOQReport.com provides food for thought to those who are suspicious of why the…
Read More
The Antichrist is Revealed As the final generation of this flesh
earth age begins to come to a close… The last week started January 2016 with renewing of the Covenant of OLD[Dan 9;27] by the invited…
Read More
Anti-Christian Bigotry Is the Only Form of Acceptable Intolerance Remaining in This Country and Abroad,What Matters to the Left
is Silencing the Christian Influence of This Nation… The Left’s goal is to replace religious faith with the progressive socialist agenda as the ruling norm…
Read More
GOD’S LOVE IN “AN EYE FOR AN EYE”
EXODUS 21 AND MATHEW 5- AN EYE FOR AN EYE… By,Edward O’Hara When the Bible speaks of an eye for an eye and a tooth…
Read More
Life doesn’t get easier you just get stronger!
II CORINTHIANS 4:8-11 (PARAPHRASED)8. We are hard pressed on every side, yet not crushed; we are perplexed, but not in despair; 9. persecuted, but not…
Read More

We make every effort to acknowledge sources used in our news articles. In a few cases, the sources were lost due to a technological glitch. If you believe we have not given sufficient credit for your source material, please contact us, and we will be more than happy to link to your article.