
The weak and stupid cull themselves
HNewsWire: All will be listening to the Monty Python refrain, “Bring out your dead.” So, basically, everything alleged about the side effects that was completely denied as false information by pharma and the government was true.
People don’t like to hear that they were tricked into poisoning themselves. Symptoms don’t define a disease; They are only an indication that something is causing a condition. Did you notice that the flu disappeared during the Covid scam? I had one lady tell me that the flu disappeared because everyone wore masks.
Remember also that VAERS is NOT the only data the CDC has available to them. They have V-Safe data and also have data supplied directly from Health Providers and Insurers. We know after FOIA releases that V-Safe shows an identical picture, so none of the objections to VAERS data have any validity.
If the CDC wishes to challenge the validity of VAERS data, let them release ALL their other data to “disprove” VAERS. In fact, as a Public Health Agency, why is it that the CDC has been sitting on ALL this data and its analysis for so long? (Spoiler: Rhetorical question!)
![]()
SUMMARY
- CDC’s VAERS safety signal analysis based on reports from Dec. 14, 2020 – July 29, 2022 for mRNA COVID-19 vaccines.shows clear safety signals for death and a range of highly concerning thrombo-embolic, cardiac, neurological, hemorrhagic, hematological, immune-system and menstrual adverse events (AEs) among U.S. adults.
- There were 770 different types of adverse events that showed safety signals in ages 18+, of which over 500 (or 2/3) had a larger safety signal than myocarditis/pericarditis.
- The CDC analysis shows that the number of serious adverse events reported in less than two years for mRNA COVID-19 vaccines is 5.5 times larger than all serious reports for vaccines given to adults in the US since 2009 (~73,000 vs. ~13,000).
- Twice as many mRNA COVID-19 vaccine reports were classified as serious compared to all other vaccines given to adults (11% vs. 5.5%). This meets the CDC definition of a safety signal.
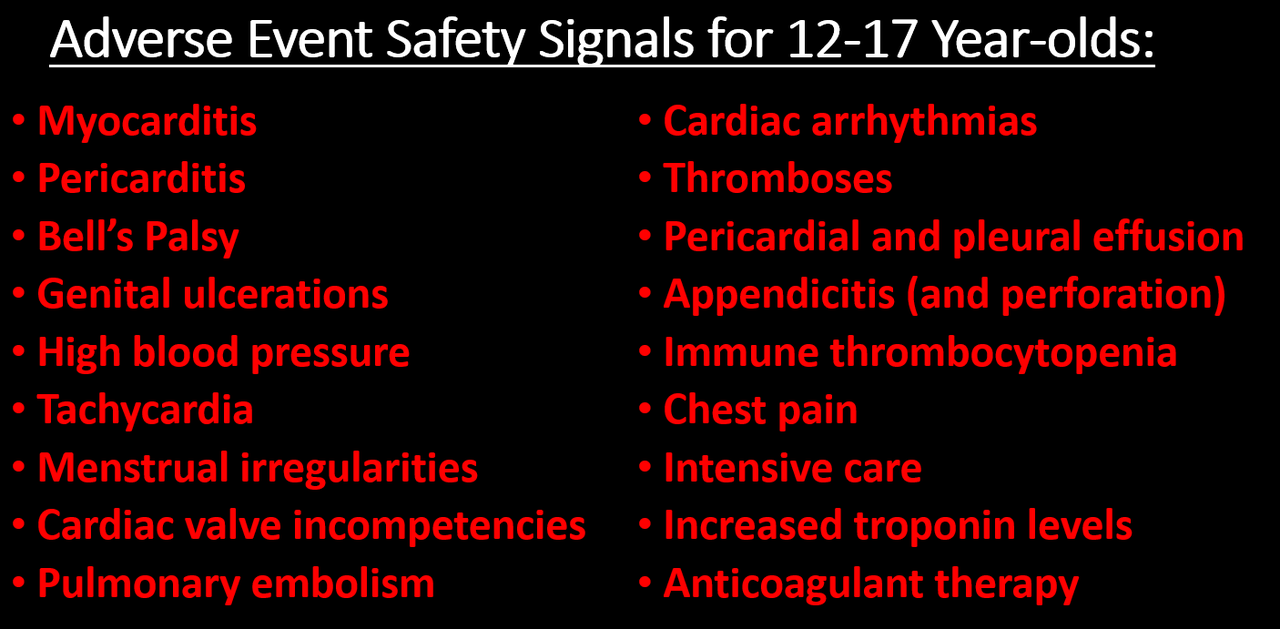
- There are 96 safety signals for 12-17 year-olds, which include: myocarditis, pericarditis, Bell’s Palsy, genital ulcerations, high blood pressure and heartrate, menstrual irregularities, cardiac valve incompetencies, pulmonary embolism, cardiac arrhythmias, thromboses, pericardial and pleural effusion, appendicitis and perforated appendix, immune thrombocytopenia, chest pain, increased troponin levels, being in intensive care, and having anticoagulant therapy.
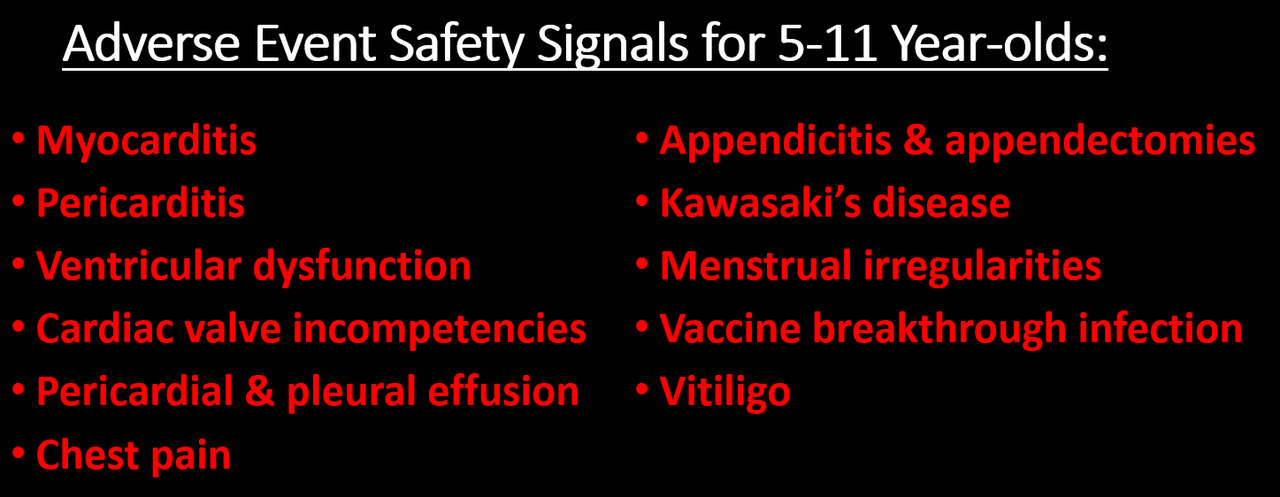
- There are 66 safety signals for 5-11 year-olds, which include: myocarditis, pericarditis, ventricular dysfunction and cardiac valve incompetencies, pericardial and pleural effusion, chest pain, appendicitis & appendectomies, Kawasaki’s disease, menstrual irregularities, vitiligo, and vaccine breakthrough infection.
- The safety signals cannot be dismissed as due to “stimulated,” exaggerated, fraudulent or otherwise artificially inflated reporting, nor can they be dismissed due to the huge number of COVID vaccines administered. There are several reasons why, but the simplest one is this: the safety signal analysis does not depend on the number of reports, but whether or not some AEs are reported at a higher rate for these vaccines than for other non-COVID vaccines. Other reasons are discussed in the full post below.
- In August, 2022, the CDC told the Epoch Times that the results of their safety signal analysis “were generally consistent with EB [Empirical Bayesian] data mining [conducted by the FDA], revealing no additional unexpected safety signals.” So either the FDA’s data mining was consistent with the CDC’s method-meaning they “generally” found the same large number of highly alarming safety signals-or the signals they did find were expected. Or they were lying. We may never know because the FDA has refused to release their data mining results.
INTRODUCTION
Finally! Zachary Stieber at the Epoch Times managed to get the CDC to release the results of its VAERS safety signal monitoring for COVID-19 vaccines, and they paint a very alarming picture (see his reporting and the data files here, or if that is behind a paywall then here). The analyses cover VAERS reports for mRNA COVID vaccines from the period from the vaccine rollout on December 14, 2020 through to the end of July, 2022. The CDC admitted to only having started its safety signal analysis on March 25, 2022 (coincidentally 3 days after a lawyer at Children’s Health Defense wrote to them reminding them about our FOIA request for it).
[UPDATE: T Coddington left a link in comments to a website where he made the data in the Excel files more accessible.]
Like me, you might be wondering why the CDC waited over 15 months before doing its first safety signal analysis of VAERS, despite having said in a document posted to its website that it would begin in early 2021-especially since VAERS is touted as our early warning vaccine safety system. You might also wonder how they could insist all the while that the COVID-19 vaccines are being subjected to the most rigorous safety monitoring the world has ever known. I’ll come back to that later. First I’m going to give a little background information on the analysis they did (which you can skip if you’re up to speed) and then describe what they found.
BACKGROUND ON SAFETY SIGNAL ANALYSIS
Back in June 2022, the CDC replied to a Freedom of Information Act (FOIA) request for the safety signal monitoring of the Vaccine Adverse Events Reporting System (VAERS)-the one it had said it was going to do weekly beginning in early 2021. Their response was: we never did it. Then a little later they said they had been doing it from early on. But by August, 2022, they had finally gotten their story straight, saying that they actually did do it, but only from March 25, 2022 through end of July. You can get up to speed on that here.
The analysis they were supposed to do uses what’s called proportional reporting ratios (PRRs). This is a type of disproportionality analysis commonly used in pharmacovigilance (meaning the monitoring of adverse events after drugs/vaccines go to market). The basic idea of disproportionality analysis is to take a new drug and compare it to one or more existing drugs generally considered safe. We look for disproportionality in the number of adverse events (AEs) reported for a specific AE out of the total number of AEs reported (since we generally don’t know how many people take a given drug). We then compare to existing drugs considered safe to see if there is a higher proportion of particular adverse events reported for the new drug compared to existing ones. (In this case they are looking at vaccines, but they still use PRR even though they generally have a much better sense of how many vaccines were administered.)
There are many ways to do disproportionality analysis. The PRR is one of the oldest. Empirical Bayesian data mining, which was supposed to be done on VAERS by the FDA, is another. The PRR is calculated by taking the number of reports for a given adverse event divided by the total number of events reported for the new vaccine or the total number of reports. It then divides that by the same ratio for one or more existing drugs/vaccines considered safe. Here is a simple formula:

So for example, if half of all adverse events reported for COVID-19 vaccines and the comparator vaccine(s) are for myocarditis, then the PRR is 0.5/0.5 = 1. If one quarter of all AEs for the comparator vaccine are for myocarditis, then the PRR is 0.5/0.25 = 2.
Traditionally, for a PRR to count as a safety signal, the PRR has to be 2 or greater, have a Chi-square value of 4 or greater (meaning it is statistically significant) and there has to be at least 3 events reported for a given AE. (This also means that if there are tons of different AEs reported for COVID vaccines that have never been reported for any other vaccine, it will not count as a safety signal. I found over 6,000 of those in my safety signal analysis from 2021.
Of course a safety signal does not necessarily mean there is a problem or that the vaccine caused the adverse event. But it is supposed to set off alarm bells to prompt closer inspection, as in this CDC pamphlet:
Ah yes, shared with the public – after first refusing to share the results and months of foot-dragging following repeated FOIA requests! We will see that the CDC has not done a more focused study on almost any of adverse events with “new patterns” (AKA safety signals).
SO WHAT DID THE CDC ACTUALLY DO?
The Epoch Times obtained 3 weeks of safety signal analyses from the CDC for VAERS data updated on July 15, 22 and 29, 2022. Here I will focus on the last one, since there is very little difference between them and it is more complete. The safety signal analysis compares adverse events1 reported to VAERS for mRNA COVID-19 vaccines from Dec. 14, 2020 through July 29, 2022 to reports for all non-COVID vaccines from Jan 1, 2009 through July 29, 2022.
PRRs are calculated separately for 5-11 year-olds, 12-15 year-olds and 18+ separately. For each age group, there are separate tables for AEs from all reports, AEs from reports marked serious and AEs from reports not marked as serious.2 Recall that a serious report is one that involves death, a life-threatening event, new or prolonged hospitalization, disability or permanent damage, or a congenital anomaly. I will focus on the reports for all AE’s.
They also have a table that calculates PRRs by comparing reports for the Pfizer COVID-19 vaccine to reports for the Moderna vaccine and vice versa, again for all reports, serious reports only and non-serious reports. There were no remarkable findings in those tables, so I will not discuss them. [Edit: I forgot what Norman Fenton noted in his analysis: the overall proportion of reports with serious adverse events is 9.6% for Modern compared to 12.6% for Pfizer.] This isn’t that surprising since both vaccines are very similar and so should present relatively similar adverse events when compared to each other, and any differences are likely not large enough to be picked up by a PRR analysis. [Though the difference in the overall rate of serious adverse events, which are not specific to a particular type of event only how serious it is, was significant.]
The CDC seems to have calculated PRRs for every different type of adverse event reported for all the COVID vaccines examined – though it’s possible they only analyzed a subset. What seems clear is that, among the AEs they examined, the only ones included in the tables satisfy at least one of two conditions: a PRR value of at least 2 and a Chi-square value of at least 4 (Chi is the Greek letter χ and is pronounced like ‘kai’). When both conditions were met, they highlighted the adverse event in yellow, which appears to indicate a safety signal. There were no COVID vaccine AEs listed with fewer than 3 reported events, though for non-COVID vaccines there were many AEs listed that had only 1 or 2 reported since 2009. The CDC tables still include these and highlight them in yellow when the PRR is greater than 2 and the Chi-square value is great than 4, indicating these events are counted as safety signals.
WHAT SAFETY SIGNALS DID THE CDC FIND?
I’m going to divide this up by age groups and the Pfizer v. Moderna comparison. Let’s start with the 18+ group.
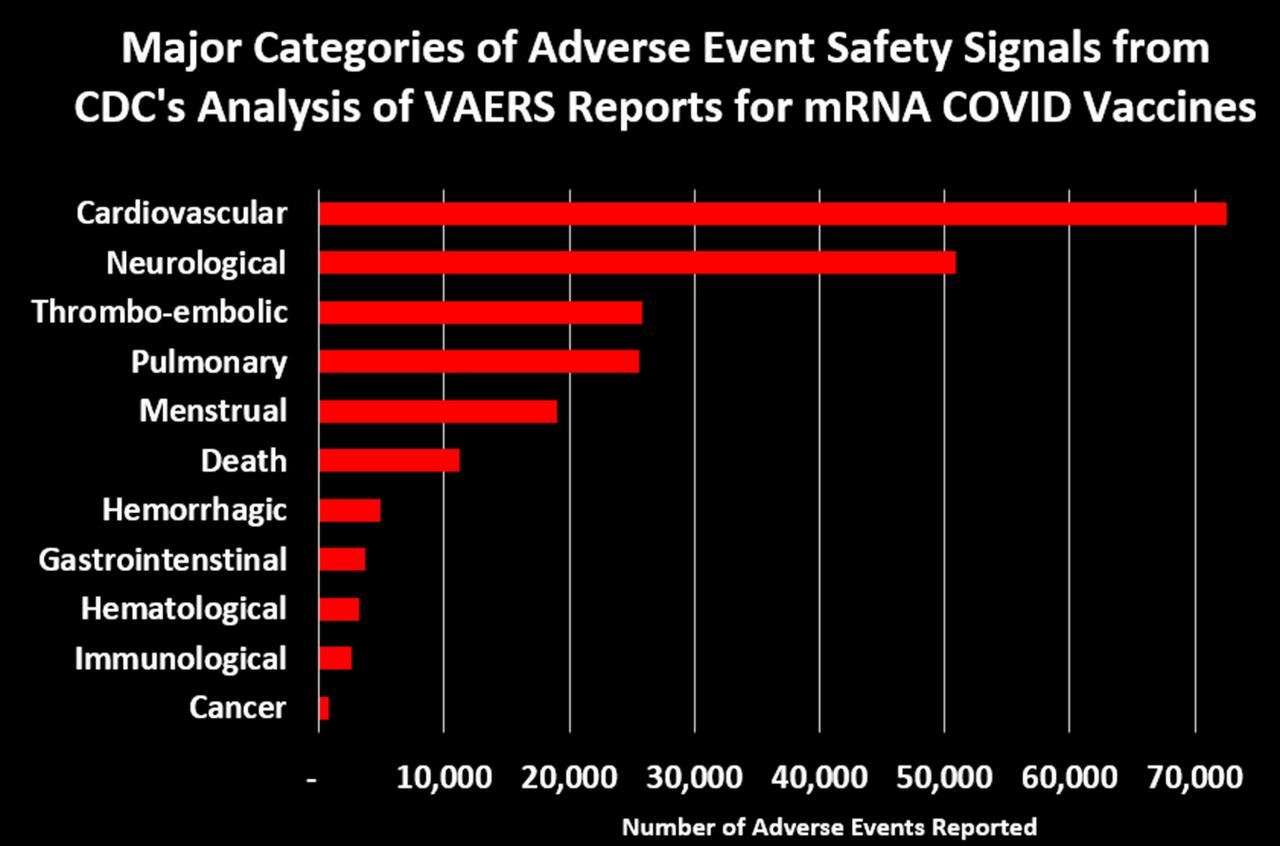
There are 772 AEs that appear on the list. Of these, 770 are marked in yellow and have PRR and Chi-square values that qualify them as safety signals. Some of these are new COVID-19 related codes, and we would expect those to trigger a signal since they didn’t exist in prior years to be reported by other vaccines. So if we take those off, we are left with 758 different types of non-COVID adverse events that showed safety signals.
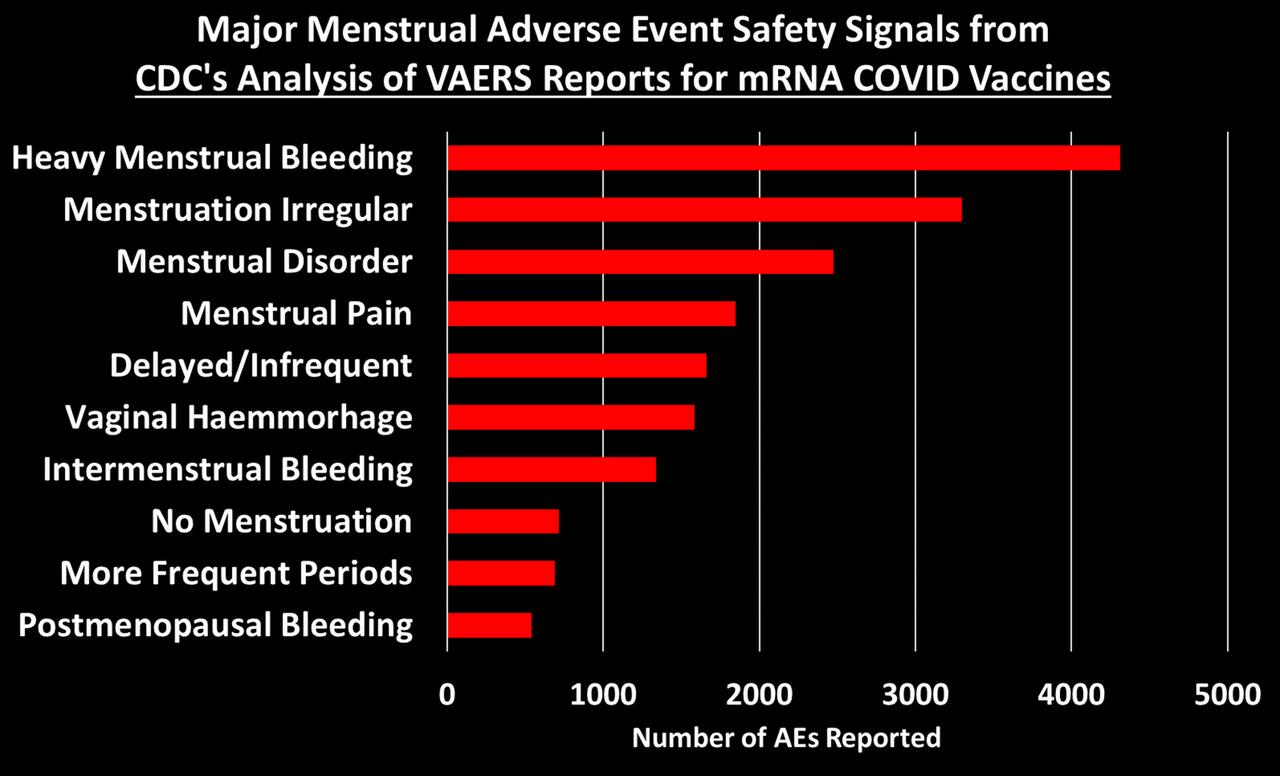
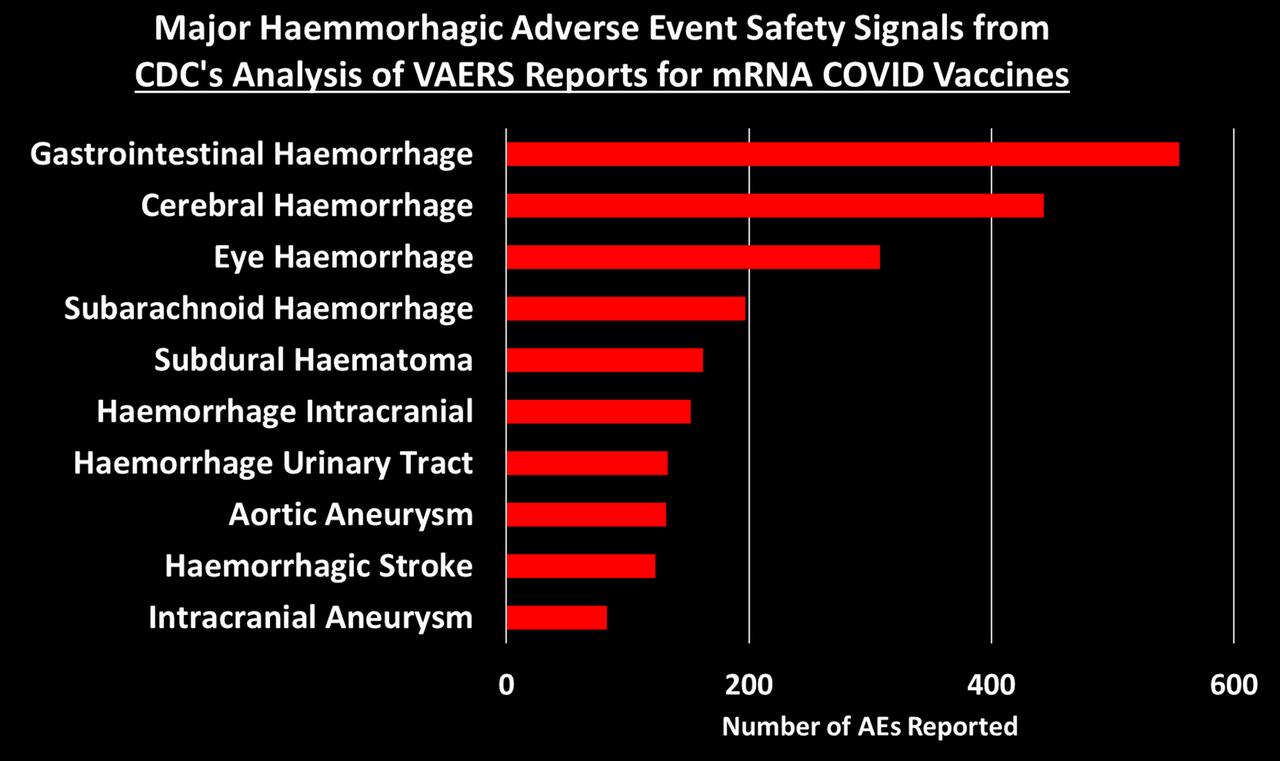
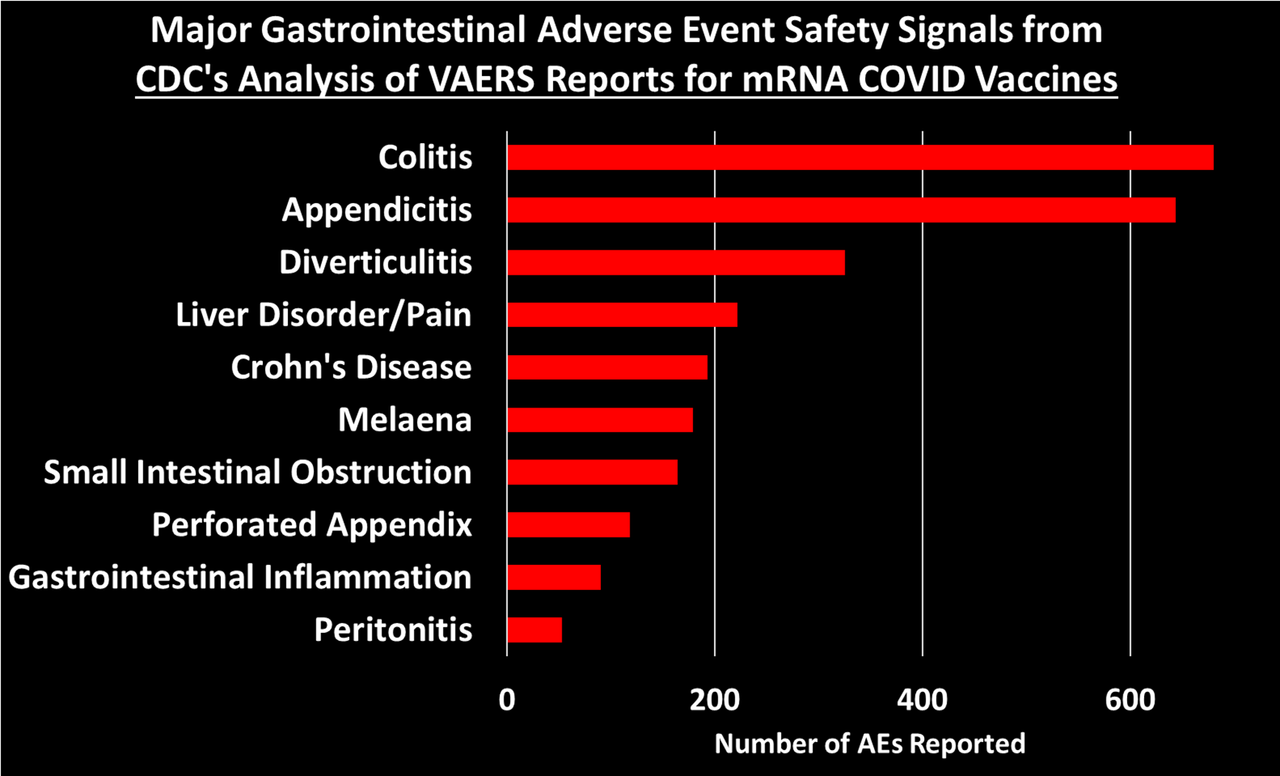
I grouped these 758 safety signals into different categories. The figure below shows the total number of AEs reported for each of the major categories of safety signals:
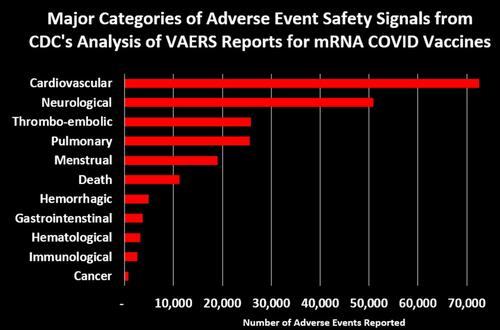
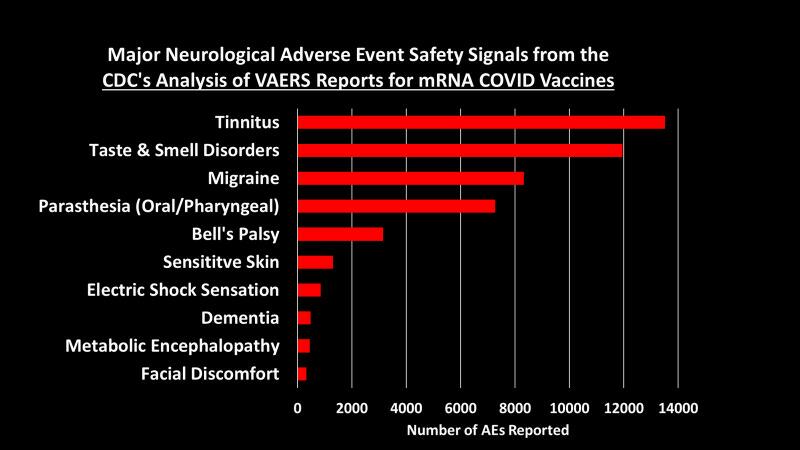
Let’s dig into some of these categories to look at what types of AEs generated the most number of reports:3
You can peruse the adverse events using the Excel tables provided by the CDC, which were posted by The Epoch Times and Children’s Health Defense at the links at the top of this post.
What about The Children?
If there is anything that looks remotely like a bright spot in all of this is that the list of safety signals for 12-17 and 5-11 year-olds is much shorter than for 18+. There are 96 AEs that qualify as a safety signal for the 12-17 group and 67 for the 5-11. When we take out the new COVID-era AEs, there are 92 safety signals for 12-17 year-olds and 65 for 5-11 year-olds. Here are the most alarming ones:
I don’t know why the list of AE’s is so much shorter for these age groups. It could be that the list of AE’s for other vaccines for these age groups is much shorter, so in a case where AEs have been reported for the mRNA COVID vaccines but not for other vaccines, it will not be counted as a safety signal by definition.
COMPARISONS TO MYOCARDITIS & PERICARDITIS
We are told that the existence of a safety signal doesn’t necessarily mean the AE is caused by the vaccine, and I accept that premise. But the current practice seems to be to ignore safety signals, dismiss them as noise without any evidence, and stall any investigation into them as long as possible. The precautionary principle, however, dictates we should presume that a safety signal indicates causality, until proven otherwise. Since, it has been acknowledged that the mRNA COVID vaccines can cause myocarditis and pericarditis (often referred to as myo-pericarditis), we can take those AEs as a kind of benchmark, and propose that, at minimum, any AE with a signal of equal or greater size should be considered potentially causal and investigated more thoroughly.4
After dropping the new COVID-era AEs, there are 503 AEs with PRRs larger than myocarditis (PRR=3.09) and 552 with PRRs larger than pericarditis (PRR=2.82).5 This means that 66.4% of the AEs had a bigger safety signal than myocarditis and 77.3% were larger than pericarditis. You can see what those were by use this Excel file provided by the CDC and sorting the 18+ tab by the 12/14-07/29 PRR column (Column E). Then just look at which AEs have PRRs larger than the ones for pericarditis and myocarditis.
For 12-17 year-olds, there is 1 safety signal larger than myocarditis (it’s ‘troponin increased’) and 14 safety signals larger than pericarditis (excluding myocarditis), which include: mitral valve incompetence, bell’s palsy, heavy menstrual bleeding, genital ulceration, vaccine breakthrough infection, and a range of indicators of cardiac abnormalities.
For 5-11 year-olds, the comparison to myo/pericarditis is less germane, as they seem to suffer less from this side effect. But we can still make the comparison: there are 7 safety signals larger than pericarditis, including bell’s palsy, left ventricular dysfunction, mitral valve incompetence, and ‘drug ineffective’ (presumably meaning they still got COVID). There are 16 safety signals larger than myocarditis (excluding pericarditis), which in addition to those listed above also include: pericardial effusion, diastolic blood pressure increase, tricuspid valve incompetence, and vitiligo. Sinus tachycardia (high heart rate), appendicitis, and menstrual disorder come in just below myocarditis.
Now if we think of a safety signal as having both strength and clarity, then the PRR can be thought of as an indicator of how strong the signal is, while the Chi-square is a measure of how clear or unambiguous the signal is, because it gives us a sense of how likely the signal is due to chance alone: the larger the Chi-square value, the less likely the signal is due to chance. A Chi-square of 4 means there is only a 5% chance the observed signal is due to chance. A Chi-square of 8 means there is only a 0.5% chance of it being due to chance.6
For the 18+ group, there are 57 AEs with a Chi-square larger than myocarditis (Chi-square=303.8) and 68 with a Chi-square larger than pericarditis (Chi-square=229.5). Again, you can see what these are by going the Excel file linked above and sorting on Column D.
For the 12-17 group, there are 4 AEs with a larger Chi-square than myocarditis (Chi-square=681.5) and 6 larger than pericarditis (Chi-square=175.4).
For the 5-11 group, there are 22 AEs with a Chi-square larger than myocarditis (Chi-square=30.42) and 34 AEs with a Chi-square larger than pericarditis (Chi-square=18.86).
RESPONDING TO OBJECTIONS
Let’s dispense with some of the criticisms used to dismiss VAERS data, which will undoubtedly be raised if you try to bring the CDC’s analysis to people’s attention.
- Objection: Anybody can report to VAERS. The reports are unreliable. Anti-vaxxers made lots of fraudulent reports. Nobody was aware of VAERS in the past, but now they are. So many people were afraid of the vaccine so they blamed all their health problems on it. Health workers were required by law to report certain adverse events, like deaths and anaphylaxis. Etc. Etc.All of these objections ultimately rely on the notion that VAERS reports for COVID-19 vaccines have been artificially inflated over previous years for one reason or another. The thing of it is, though, that the CDC has a method for distinguishing between artificial inflation and real signal. The idea is simple: if adverse events are artificially inflated, they should be artificially inflated to the same degree. Meaning, the PRRs for all of these safety signals should be about the same. But even a casual glance at the PRRs in the Excel file show they vary widely, from as low at 2 to as high as 105 for vaccine breakthrough infection or 74 for cerebral thrombosis. This method does not on the number of reports, but the rate of reporting for certain events out of all events reported. If anything, this method would tend to hide safety signals in a situation where a new vaccine generates a very large number of reports. The CDC has even done us the favor of calculating upper and lower confidence intervals, meaning that we can be at least 95% confident that two PRRs are truly different if their confidence intervals don’t overlap. So for example the lower confidence interval for pulmonary thrombosis is 19.7, which is higher than the upper confidence interval for 543 other signals. Artificially inflated reporting cannot explain why so many different adverse events have large PRRs that are statistically distinct from one another.
- Objection: The safety signals are due to the huge number of COVID vaccines given out. Never before have we given out so many vaccine doses. By the end of July, the US had administered something like 600 million vaccine doses to people aged 18+. But the CDC analysis compares VAERS reports for these doses to all doses for all other vaccines for this age group since Jan. 1, 2009. But from 2015-2020 there were over 100 million flu doses administered annually to this age group alone. In previous work, I estimated 538 million doses of flu given to people 18+ from July 2015-June 2020. The number of flu and other non-COVID vaccines for this age group administered from Jan 1., 2009 through July 29, 2022 must be well over double this number, meaning VAERS reports for COVID vaccines are being compared to reports for at least double the number of doses for other vaccines. In addition to this, as already noted, the PRR methodology does not depend, strictly speaking, on the number of doses, but rather the rate of reporting of a specific AE out of all AEs for that vaccine.
- Objection: the vaccines are mainly being given to older people who tend to have health problems, whereas other vaccines are given to younger people. This objection is dealt with, since the analyses are stratified by age groups. It might be still be somewhat valid for the 18+ group, except that in the safety signal analysis I did in the fall of 2021, I stratified by smaller age bands and still found safety signals. In any case, this objection is not enough to dismiss the safety signal analysis out of hand, but rather calls for better and more refined research.
- Objection: The VAERS data is not verified and cannot be trusted. I’ll be the first person to agree that VAERS is not high quality data, but if it is completely untrustworthy, then how is it that the CDC uses these data to publish in the best medical journals such as JAMA and The Lancet? If the data were worthless, then these journals shouldn’t accept these papers. In that JAMA paper, they reported that 80% of the myocarditis reports met their definition of myocarditis and were included in the analysis. Many other reports simply needed more details for validation. Furthermore, the CDC has the ability and budget to follow-up on every report VAERS receives to get more details and even medical records to verify the report.So if myocarditis shows a clear signal in the CDC’s analysis, and 80% of those reports were apparently high quality enough to be included in a paper published in one of the world’s top medical journals, how is it possible that all the rest of the reports are junk? That all of the other safety signals are meaningless? Answer: it isn’t. And since we’re on the topic of safety signals that turned out to be real, it’s instructive to find appendicitis turn up as a safety signal in all 3 age groups, since a study published in NEJM based on medical records of over a million adult Israelis found an increased risk of appendicitis in the 42 days following Pfizer vaccination (but not following a positive SARS-CoV-2 PCR test). That study also found an increase in lymphadenopathy (swollen lymph nodes) after vaccination, but not after positive COVID test. Lymphadenopathy was another safety signal.
- And that brings us to our last objection to be dispensed with: all of these AEs were due to COVID. There was an epidemic and so people were falling ill due to COVID and having all of these problems that were then blamed on the vaccine. Well to begin with, as we just saw, at least two of them (appendicitis and lymphadenopathy) do not appear to have increased risk ratios following a positive SARS-CoV-2 test, and we know that the mRNA vaccines increase risk of myo/pericarditis independent of infections. So how can we assume the rest of these are and dismiss them with the wave of a hand? We can’t. At minimum, they need further investigation. Furthermore, in the safety signal analysis I did in 2021, I dropped all VAERS reports where any sign of a SARS-CoV-2 exposure or infection was indicated on the report, and I still found large, significant safety signals.
PUTTING IT ALL INTO PERSPECTIVE
The Epoch Times article quotes my esteemed colleague and friend, Norman Fenton, Professor of Risk Management and an world renowned expert in Bayesian statistical analysis: “from a Bayesian perspective, the probability that the true rate of the AE of the COVID-19 vaccines is not higher than that of the non-COVID-19 vaccines is essentially zero…. The onus is on the regulators to come up with some other causal explanation for this difference if they wish to claim that the probability a COVID vaccine AE results in death is not significantly higher than that of other vaccines.” (See his post on the CDC analysis here.) The same is true for all the safety signals they found.
The CDC’s VAERS SOP analysis document lists 18 Adverse Events of Special Interest says they are going to pay close attention to. In their 2021 JAMA paper (and similar presentations to ACIP), the researchers responsible for analyzing the millions of medical records in the CDC’s Vaccine Safety Datalink (VSD) using the ‘Rapid Cycle Analysis’ only studied 23 outcomes. A Similar analysis in NEJM from Israeli researchers focused on only 25 outcomes. Compare this to over 700 safety signals found by the CDC when they finally decided to look-and that’s not even counting all the adverse events that have never been reported for other vaccines so cannot ever show a safety signal by definition. How can the CDC say that these safety signals are meaningless if almost none of them have been studied any further? And yet we are assured that these vaccines have undergone the most intensive safety monitoring effort in history. It’s complete and utter hogwash!
* * *
Josh Guetzkow is a senior lecturer at The Hebrew University of Jerusalem. Subscribe to his Substack here.
1) To be precise, the ‘adverse events’ are for ‘preferred terms’ (PTs) which is a type/level of classification used in the Medical Dictionary for Regulatory Activities (MedDRA), which is the classification system used by VAERS and in other pharmacovigilance systems and clinical research for coding reported adverse events. Not all preferred terms are a symptom or adverse event per se. Some refer to a specific diagnostic test that was done or a treatment that was given.
2) It’s not entirely clear how they divided these up, since there are clearly AEs that should be considered serious that don’t show up in the serious Excel table – though maybe they don’t come up simply because they are looking within serious reports. I believe that they just filtered the reports to include only serious reports or non-serious reports, then did the safety signal analysis on all the AE’s coded in those reports. The reason I think this is that I used the MedAlerts Wayback Machine, selected just the serious COVID-19 vaccine reports, and the numbers of total reports was very close to the one in the table provided by the CDC (MedAlerts actually had a bit less). The files obtained by the Epoch Times do not include much in the way of a description as to how the analyses were done, so I had to infer some details, which might be incorrect. I will try to note when I am drawing an inference about how the analysis was done.
3) Generally speaking, these figures show the top ten AEs in each category. In some cases I combined AEs that indicated the same thing, such as combining ‘heart rate irregular’ with ‘arrythmia.’ [UPDATE: Note that the charts of all categories, cardiac and thrombo-embolic events were updated on Jan 7, 2023. The reason is that I had previously categorized acute myocardial infarction as a cardiac issue and myocardial infarction as thrombo-embolic. To be consistent, I have now combined myocardial infarction and acute myocardial infarction into one AE category in the thrombo-embolic events (which made the total AEs reported for that category larger than for pulmonary ones) and then added a different cardiac AE to the cardiovascular AE category, ventricular extrasystoles, AKA premature ventricular contraction (PVC), which dependent on frequency and the presence of other cardiomyopathies is associated with sudden cardiac arrest.]
4) Note that using the myo-pericarditis signal as a yardstick doesn’t mean that these are the only signals that matter. To give one example, anaphylactic reactions don’t even show up in the list of safety signals, even though that was one of the very first risk of the vaccine that became apparent from day one of the vaccine rollout.
One potential objection to this benchmark is that it is too low of a bar, since myo-pericarditis appears to disproportionately affect younger men and so a proper safety signal should be stratified by age and gender then compared with myocarditis similarly stratified. I agree, and it is the CDC’s job to do that. But the fact is that any adverse reaction might disproportionately affect some subgroup of people, in which case the safety signal for that group would be similarly faint or diluted when we look at everyone together. So objection overruled.
5) In their Standard Operation Procedures document, the CDC said they would combine these and related codes together to assess a safety signal, but never mind – at least they finally got around to doing something.
6) In this context, the Chi-square is largely driven by the sheer number of adverse events: the more adverse events reported, including for the comparator vaccine, the larger the Chi-square. For example, the PRR for pericarditis and subdural haematoma is the same (2.82), but there were 1,701 incidents of pericarditis reported for mRNA COVID vaccines versus 221for the comparator vaccines, with Chi-square of 229.5. For subdural haematoma, these numbers are 162 verus 21, for a Chi-square of 21.2.

SRH : Evil is usually thought of as that which is morally wrong, sinful, or wicked; however, the word evil can also refer to anything that causes harm, with or without the moral dimension. The word is used both ways in the Bible. Anything that contradicts the holy nature of God is evil (see Psalm 51:4). On the flip side, any disaster, tragedy, or calamity can also be called an “evil” (see 1 Kings 17:20, KJV).
Evil behavior includes sin committed against other people (murder, theft, adultery) and evil committed against God (unbelief, idolatry, blasphemy). From the disobedience in the Garden of Eden (Genesis 2:9) to the wickedness of Babylon the Great (Revelation 18:2), the Bible speaks of the fact of evil, and man is held responsible for the evil he commits: “The one who sins is the one who will die” (Ezekiel 18:20).
Essentially, evil is a lack of goodness. Moral evil is not a physical thing; it is a lack or privation of a good thing. As Christian philosopher J. P. Moreland has noted, “Evil is a lack of goodness. It is goodness spoiled. You can have good without evil, but you cannot have evil without good.” Or as Christian apologist Greg Koukl has said, “Human freedom was used in such a way as to diminish goodness in the world, and that diminution, that lack of goodness, that is what we call evil.”
God is love (1 John 4:8); the absence of love in a person is un-God-like and therefore evil. And an absence of love manifests itself in unloving behavior. The same can be said concerning God’s mercy, justice, patience, etc. The lack of these godly qualities in anyone constitutes evil. That evil then manifests itself in behavior that is unmerciful, unjust, impatient, etc., bringing more harm into the good world that God has made. As it turns out, we lack a lot: “As it is written: ‘There is no one righteous, not even one'” (Romans 3:10).
Moral evil is wrong done to others, and it can exist even when unaccompanied by external action. Murder is an evil action, but it has its start with the moral evil of hatred in the heart (Matthew 5:21-22). Committing adultery is evil, but so is the moral evil of lust in the heart (Matthew 5:27-28). Jesus said, “What comes out of a person is what defiles them. For it is from within, out of a person’s heart, that evil thoughts come-sexual immorality, theft, murder, adultery, greed, malice, deceit, lewdness, envy, slander, arrogance and folly. All these evils come from inside and defile a person” (Mark 7:20-23).
Those who fall into evil behavior usually start slowly. Paul shows the tragic progression into more and more evil in Romans 1. It starts with refusing to glorify God or give thanks to Him (Romans 1:21), and it ends with God giving them over to a “depraved mind” and allowing them to be “filled with every kind of wickedness” (verses 28-29).
Those who practice evil are in Satan’s trap and are slaves to sin: “Opponents [of the Lord’s servant] must be gently instructed, in the hope that God will grant them repentance leading them to a knowledge of the truth, and that they will come to their senses and escape from the trap of the devil, who has taken them captive to do his will” (2 Timothy 2:25-26; see also John 8:34). Only by the grace of God can we be set free.
Physical evil is the trouble that befalls people in the world, and it may or may not be linked to moral evil or divine judgment. Ecclesiastes 11:2 counsels us to diversify our investments, for this reason: “thou knowest not what evil shall be upon the earth” (KJV). The word evil in this case means “disaster,” “misfortune,” or “calamity,” and that’s how other translations word it. Sometimes, physical evil is simply the result of an accident or causes unknown, with no known moral cause; examples would include injuries, car wrecks, hurricanes, and earthquakes. Other times, physical evil is God’s retribution for the sins of an individual or group. Sodom and the surrounding cities were destroyed for their sins (Genesis 19), and God “made them an example of what is going to happen to the ungodly” (2 Peter 2:6). Many times, God warned Israel of the calamities that awaited them if they rebelled: “[The LORD] also is wise, and will bring evil, and will not call back his words: but will arise against the house of the evildoers, and against the help of them that work iniquity” (Isaiah 31:2, KJV). In all cases, God works through the situation to bring about His good purpose (Romans 8:28).
God is not the author of moral evil; rather, it is His holiness that defines it. Created in God’s image, we bear the responsibility to make moral choices that please God and conform to His will. He wills our sanctification (1 Thessalonians 4:3) and does not wish us to sin (James 1:13). In repentance and faith in Christ, we have forgiveness of sin and a reversal of the moral evil within us (Acts 3:19). As God’s children, we walk according to this command: “Do not be overcome by evil, but overcome evil with good” (Romans 12:21).
Sources: ZeroHedge HNewsWire HNewsWire HNewsWire


![]()